How to get your Dask Dashboard inside a JupyterLab notebook
Table of Contents
When you create a Dask client, you can head over to an url to see a dashboard of what is happening. Since Dask allows us to visualize what is happening under the hood, when using a notebook: To do that, we need two things:
By having the Dask Dashboard inside your notebook, you can use that to visualize any work that is being done. It can also help you diagnose performance issues that you might have with your code.
Install
Throughout this article, I am going to be using conda to install dependencies and manage my environments. You can use pip as well if you prefer.
First, let's install JupyterLab if you haven't installed already.
shell1conda install -c conda-forge jupyterlabThe Dask extension will need you to install nodejs. Install nodeJs from conda-forge because this will install the latest node version - the one from conda is a few versions behind.
text1conda install -c conda-forge nodejsThen we need to install the Dask Extension
shell1conda install -c conda-forge dask-labextensionOnce that is done, we have to build the extension with two commands
shell1jupyter labextension install dask-labextension2jupyter serverextension enable dask\_labextensionConfiguration
By default, the extension will launch a local cluster, but it gives you the ability to both launch and manage other kinds of Dask clusters. If you are using a local cluster, you don't need to do anything else.
If you need to manage other kinds of clusters, then you will have to configure them accordingly from a yaml file. Please read the README of the Extension for more information on this matter.
Start your JupyterLab notebook
The Dask extension is now installed, we will need a notebook to try out the extension. If you don't have one, a great place to start is by using the Dask Tutorial that you can clone from GitHub.
When you have a dask notebook, we can go ahead and start the JupyterLab notebook:
shell1jupyter labYou will get an URL that will look like http://localhost:8888/?token=<token> if you go to that URL, you will see the Dask extension on the left.
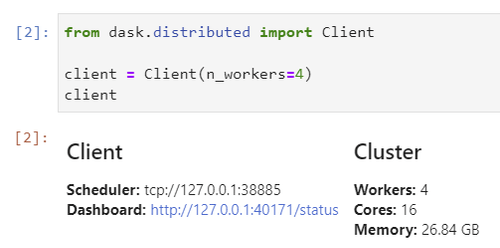
To be able to use the extension, you first need to create a client with Dask which will give you a Dask dashboard URL.
python1from dask.distributed import Client2
3client = Client(n_workers=4)4clientMost notebooks from the tutorial will contain this step, but you might need to add the client part, to get your dashboard URL.
You can now use that URL http://127.0.0.1:40171/status on the Dask extension tab, the buttons will turn orange to say that you can now open new windows. The great thing about this extension is that you can move windows around and have your notebook on one side and all the diagnostics windows open around your notebook.
Video
If you prefer to watch a video on how to install and use the Dask Extension, here's a great introduction from Matt.


